
Q3 - 2026 Wrap Up
The Liquidity Tide Turns
A year ago, in our third-quarter 2025 letter, we described a synchronized pivot among the world's central banks toward easier money and argued that the liquidity it released would carry asset prices higher. It did. This quarter, that pivot reversed. In the span of nine days in September, the European Central Bank, the Federal Reserve, and the Bank of Japan each raised interest rates, while long-term Treasury yields climbed to levels last seen before the 2008 financial crisis. Liquidity, which we have long regarded as the single most important driver of asset prices, is now tightening on two fronts: through the cost of money and through the size of central bank balance sheets.
On the surface, markets took the shift in stride. The S&P 500 returned 2.6% in the third quarter and 12.7% for the year, while the Nasdaq Composite added 2.5%. The Dow Jones Industrial Average fell 2.7%. Beneath the headline, however, the picture was far less comfortable. The index's advance rested on a narrow group of large technology and AI-related companies; by quarter-end, 83% of S&P 500 members were trading more than 10% below their 52-week highs, and 42% had fallen more than 20%. Small-cap stocks, which led the market in the second quarter, surrendered a meaningful share of those gains, with the Russell 2000 declining 7.2% for the quarter, including its steepest monthly loss since March 2025 in September. Energy was the quarter's best-performing sector, as renewed conflict in the Middle East pushed Brent crude back toward $100 per barrel.
In July, we wrote that the liquidity tailwind behind this year's rally had expired and that the weight of the evidence had shifted toward caution. The third quarter bore that out. In this letter, we examine the forces behind the tightening—a more hawkish Federal Reserve, a global bond selloff, and Washington's efforts to contain it—alongside the geopolitical calendar ahead and the market's technical condition. Taken together, they inform our central expectation: the road into 2027 is likely to be considerably more turbulent than the one behind us.
Fundamental Landscape
This quarter's fundamental discussion centers on a single theme: the tightening of liquidity. It is arriving through two channels—interest rates and central bank balance sheets—and is being amplified by a bond market that has begun to set terms of its own.
The Fed Moves - and the World Follows
On September 16, the Federal Reserve raised its benchmark rate by a quarter point to a range of 3.75% to 4.00%, its first increase since 2023. The vote was unanimous, and the statement was unusually direct. “Inflation remains elevated,” the Committee wrote. “The Committee will deliver price stability.” In effect, the Fed has now reversed the final rate cut of its prior easing cycle.
At the July meeting, three regional Fed presidents had dissented in favor of an increase, and a run of firmer inflation data through the summer tipped the balance. Chairman Kevin Warsh was careful in his framing, describing the move as removing accommodation rather than tightening policy, but the Committee's projections leave little doubt about the direction of travel. The median policymaker now expects the federal funds rate to end the year at 4.25%, implying one more increase before year-end, and to remain there through 2027. The Fed's own forecasts show core PCE inflation—its preferred gauge, which excludes food and energy—ending this year at 3.4% and not returning to the vicinity of its 2% target until 2028. Inflation has now run above the Fed's target for more than five years.
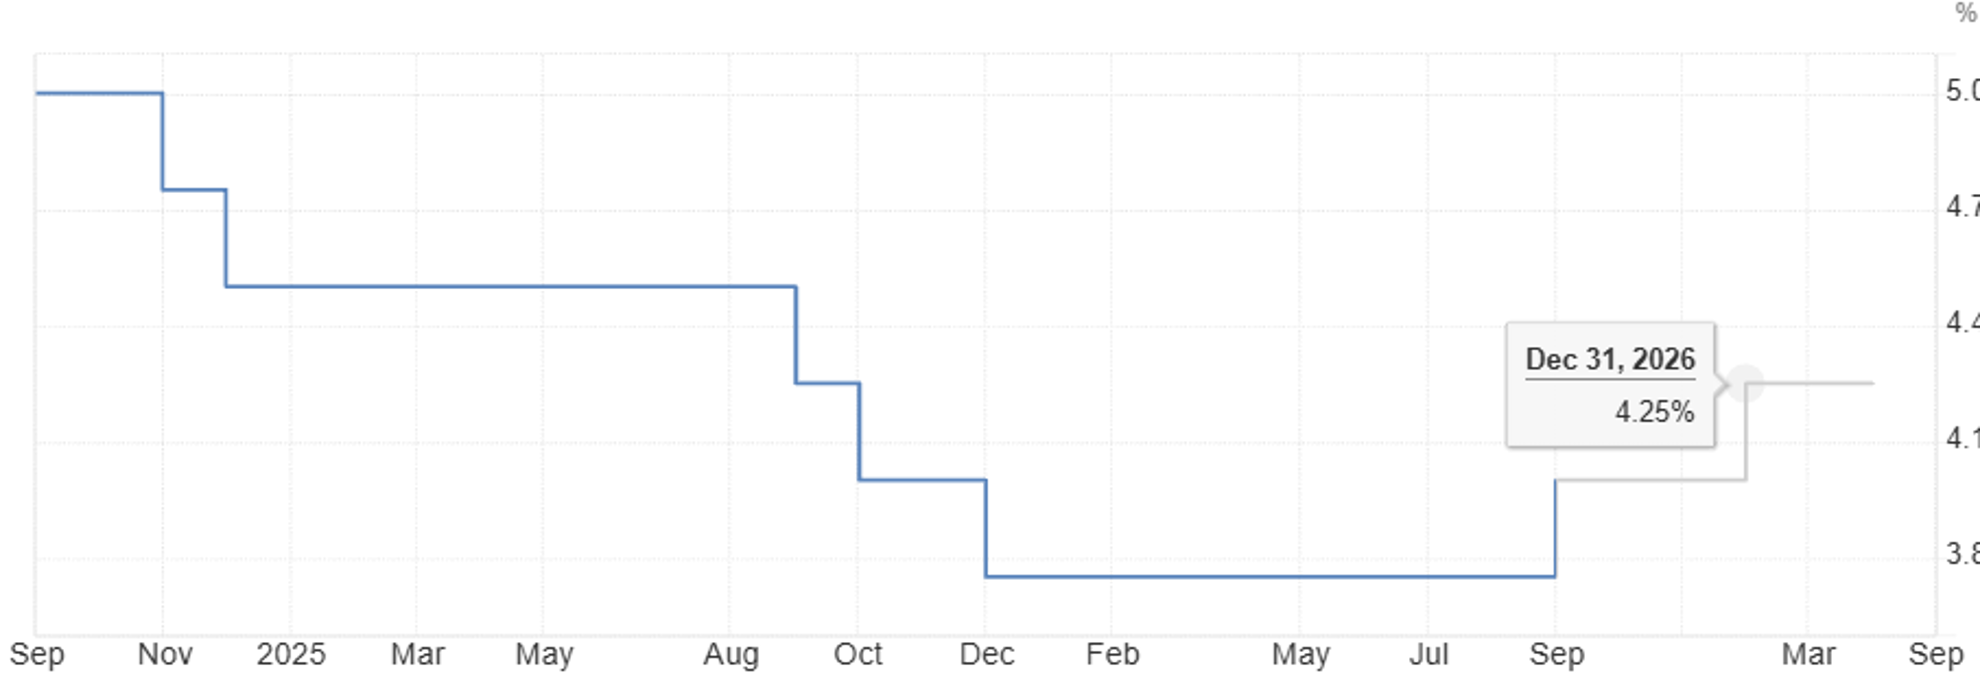
Federal funds target rate (upper bound), September 2024 to present, with a projected 4.25% by year-end 2026. Source: TradingEconomics.com.
What makes this moment distinct is that the Fed is not acting alone. On September 10, the European Central Bank raised its deposit rate to 2.5%, its second increase in three months. Eight days later, the Bank of Japan lifted its policy rate to 1.25%, the highest level since 1995. The Bank of England held steady, but three of its nine policymakers voted for an increase. The synchronized easing that powered markets in 2024 and 2025 has given way to a synchronized tightening. For investors, the significance lies not in any single quarter-point move, but in the fact that the world's major sources of liquidity are now moving in the same direction—away from accommodation.
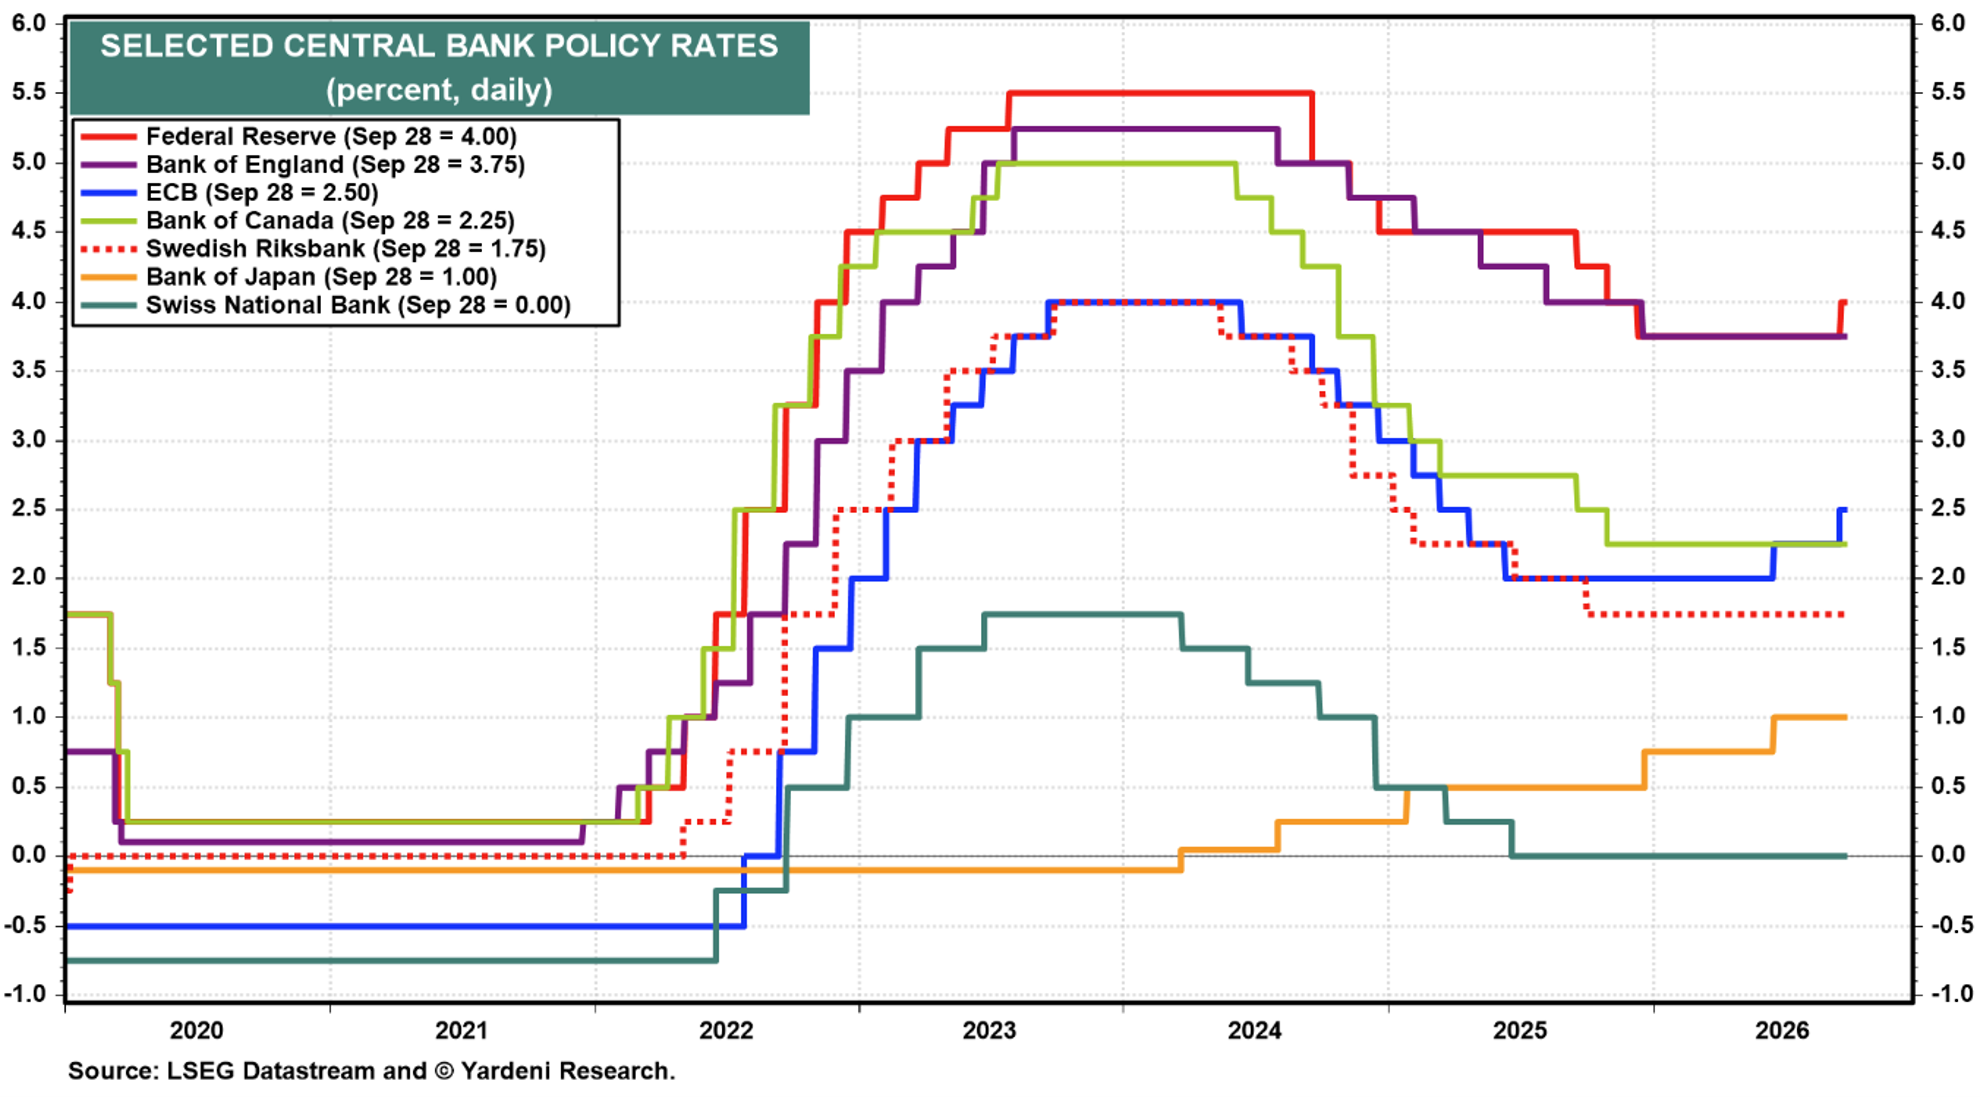
Selected central bank policy rates, daily: Federal Reserve, Bank of England, ECB, Bank of Canada, Swedish Riksbank, Bank of Japan, and Swiss National Bank. Bank of Japan reading predates its September 18 increase to 1.25%. Source: LSEG Datastream and Yardeni Research, as of September 28, 2026.
The Bond Market Revolt
If the Fed set the tone, the bond market amplified it. The 10-year Treasury yield—the benchmark for mortgages, corporate borrowing, and the valuation of nearly every financial asset—rose 54 basis points in September alone to 5.29%, its largest monthly increase in four years. The 30-year yield climbed to 5.62%. Over the course of the quarter, the 10- and 30-year yields reached their highest levels since 2007 and 2002, respectively.
Several forces converged: resilient economic growth, persistent inflation, higher energy prices, a more hawkish Fed, and an unrelenting supply of new debt. That supply comes from Washington, which continues to run large deficits, and increasingly from corporations borrowing heavily to finance the build-out of artificial intelligence infrastructure. As we noted a year ago, roughly $20 trillion of federal debt is scheduled to be refinanced between 2025 and 2029. Every increase in yields raises the cost of that rollover and adds to the supply the market must absorb.
Rising long-term yields are, in effect, a form of tightening the Fed never has to announce. They raise the cost of capital for every borrower, reduce what investors are willing to pay today for future earnings, and offer a credible alternative to stocks. A 10-year Treasury yielding more than 5% poses a simple question to equity investors: how much additional return is required to justify the additional risk? With large-cap valuations already elevated, that question has become harder to answer favorably. It is no coincidence that the businesses most sensitive to borrowing costs—smaller companies, real estate, and utilities—absorbed the brunt of the quarter's damage.
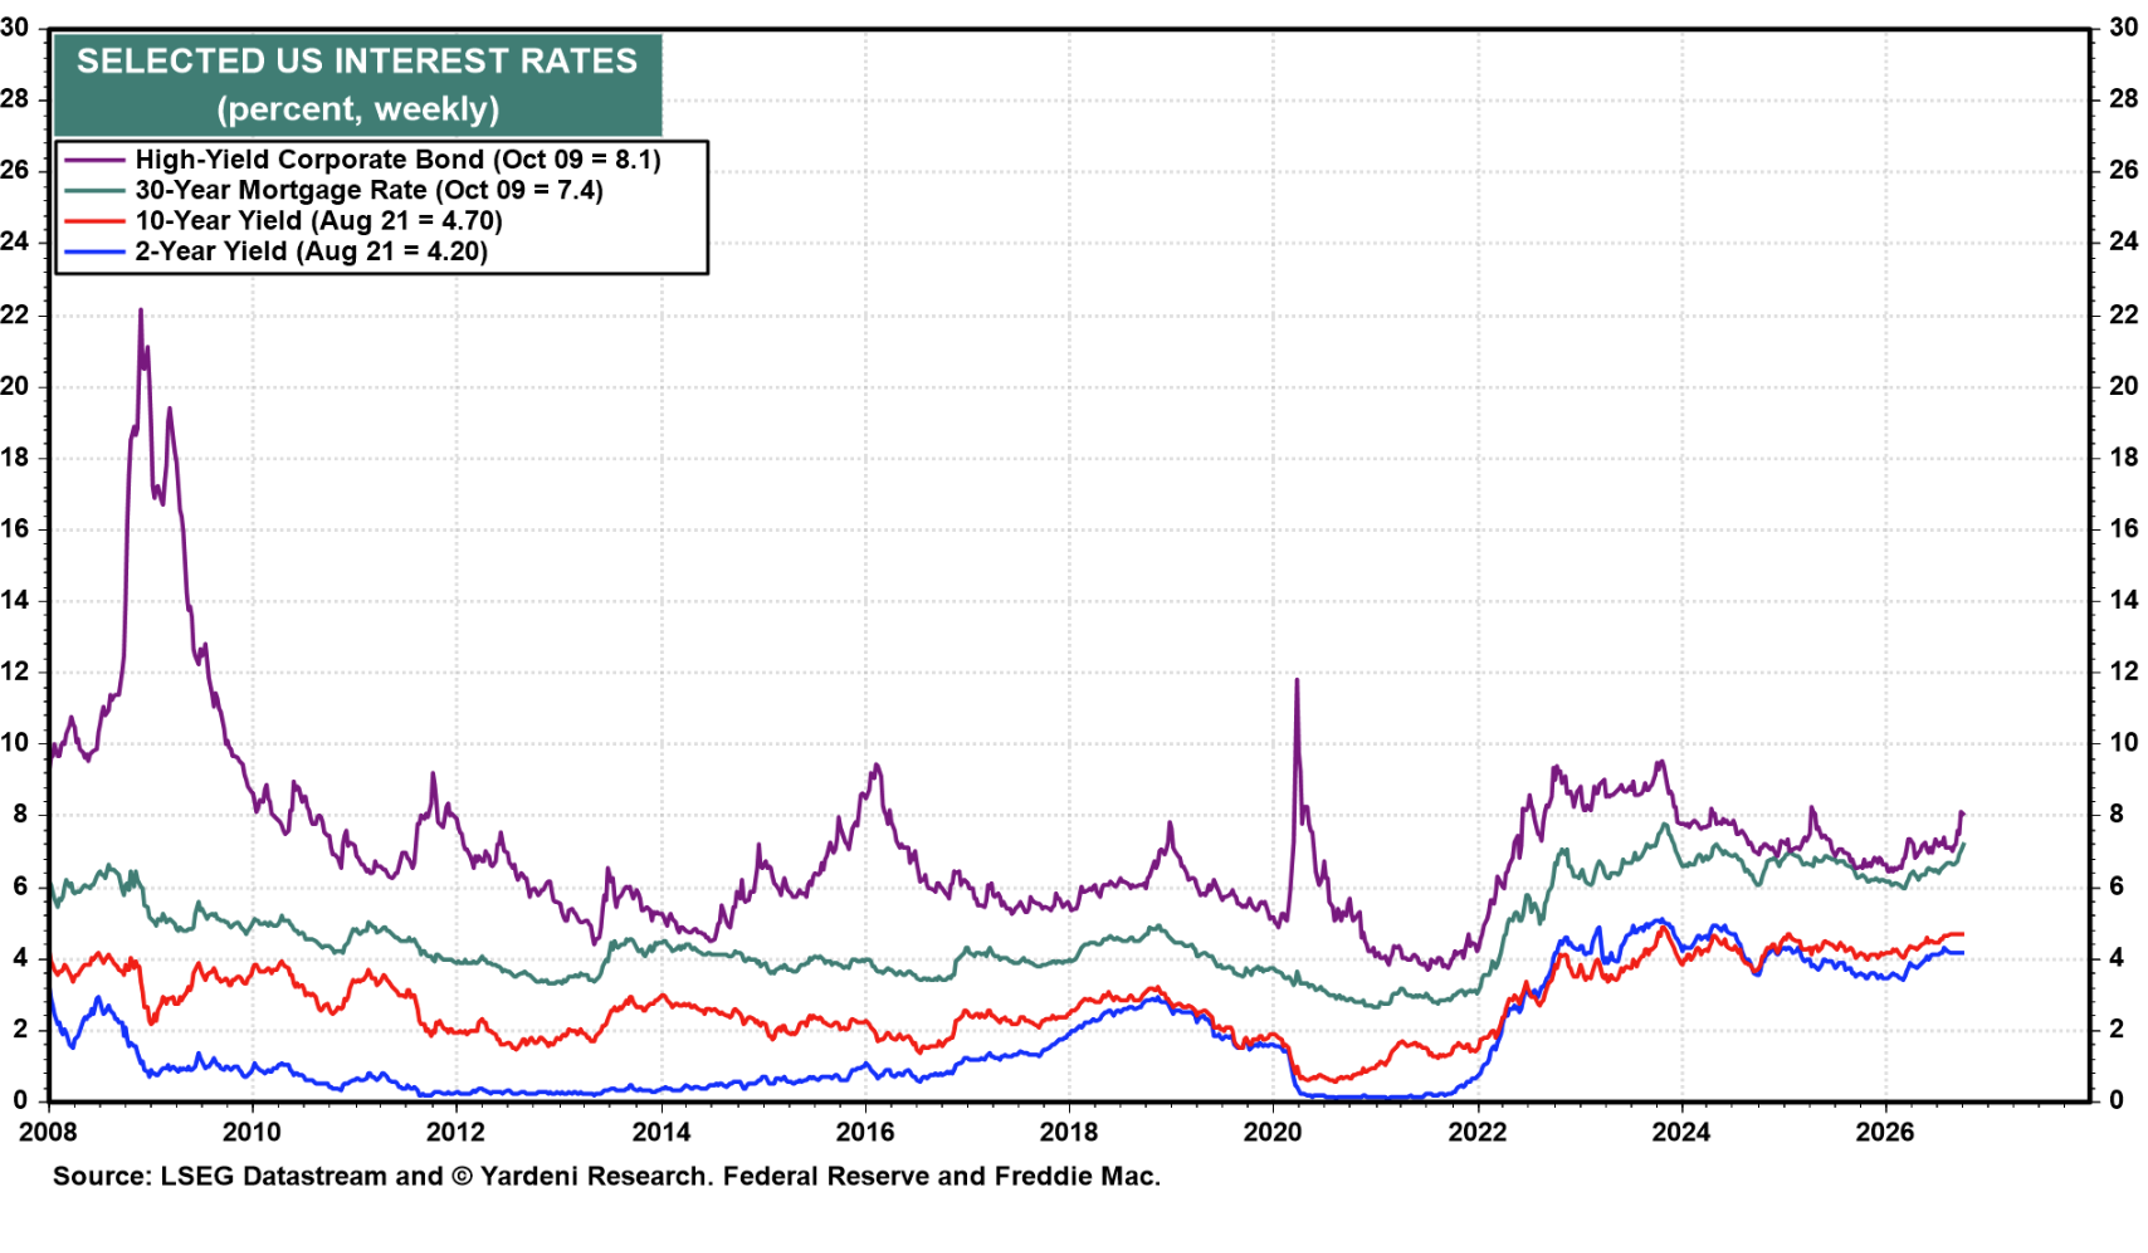
Selected U.S. interest rates, weekly: high-yield corporate bonds and 30-year mortgage rate (as of October 9, 2026), and 10- and 2-year Treasury yields (as of August 21, 2026, prior to September's surge). Source: LSEG Datastream, Yardeni Research, Federal Reserve, and Freddie Mac.
The Treasury Twist: Financial Repression Returns
Washington has not watched the rise in yields passively. On August 19, the Treasury Department announced it would double the size of its buybacks of long-dated government bonds—to at least $4 billion per operation, targeting maturities of 10 to 30 years—through early November. The purchases are financed by issuing additional short-term Treasury bills, effectively exchanging long-term debt for short-term debt to relieve pressure at the long end of the curve. Treasury Secretary Scott Bessent dubbed the program a “Treasury twist” and has argued that long-term yields do not reflect underlying fundamentals.
The name is a deliberate nod to history, and to the framework we laid out in April. In 1961, the Federal Reserve launched “Operation Twist,” selling short-term securities and buying long-term bonds to hold down long-term interest rates. Two decades earlier, during and after World War II, the Fed capped Treasury yields outright to ease the burden of wartime debt. In our April letter, we described the approach now known as financial repression: holding interest rates below the pace of economic growth so that inflation quietly erodes the real value of government debt. We argued that today's environment bears a striking resemblance to the period between 1949 and 1980. The Treasury Twist is perhaps the clearest evidence yet that the parallel is more than academic.
To date, the results have been modest. Long-term yields eased briefly after the announcement before resuming their climb through September. More important than the program's scale, however, is what it reveals. The Fed is tightening at the short end of the yield curve while the Treasury works to suppress the long end. In our third-quarter 2025 letter, we described the Treasury and the Fed as quietly coordinating; that coordination has now given way to tension. When the two arms of economic policy pull in opposite directions, the bond market is left to arbitrate between them. That is a recipe for volatility, not stability.
Central Bank Balance Sheets and Global Liquidity
The second channel of tightening runs through central bank balance sheets. Here the story is more subtle, but the direction is the same. After shrinking its holdings by roughly $2.5 trillion between 2022 and late 2025, the Federal Reserve halted quantitative tightening in December and spent the early months of this year purchasing Treasury bills to stabilize short-term funding markets. That temporary support, which helped fuel the spring rally, ended in April.
Since then, the Fed's balance sheet has held roughly flat near $6.7 trillion. A flat balance sheet may sound neutral, but it is not. As the economy grows, a balance sheet held constant shrinks relative to the system it supports—a quiet, passive form of tightening. More importantly, the policy bias points lower. In June, Chairman Warsh launched a formal review of the balance sheet's size and composition, and he has long argued that the Fed's portfolio, particularly its roughly $2 trillion in mortgage-backed securities, is larger than necessary. The Fed has not yet announced a resumption of runoff, but we view renewed reduction as a matter of when rather than if. Abroad, the Bank of Japan continues to shrink its holdings as it normalizes policy, and the ECB continues down the path of reduction.
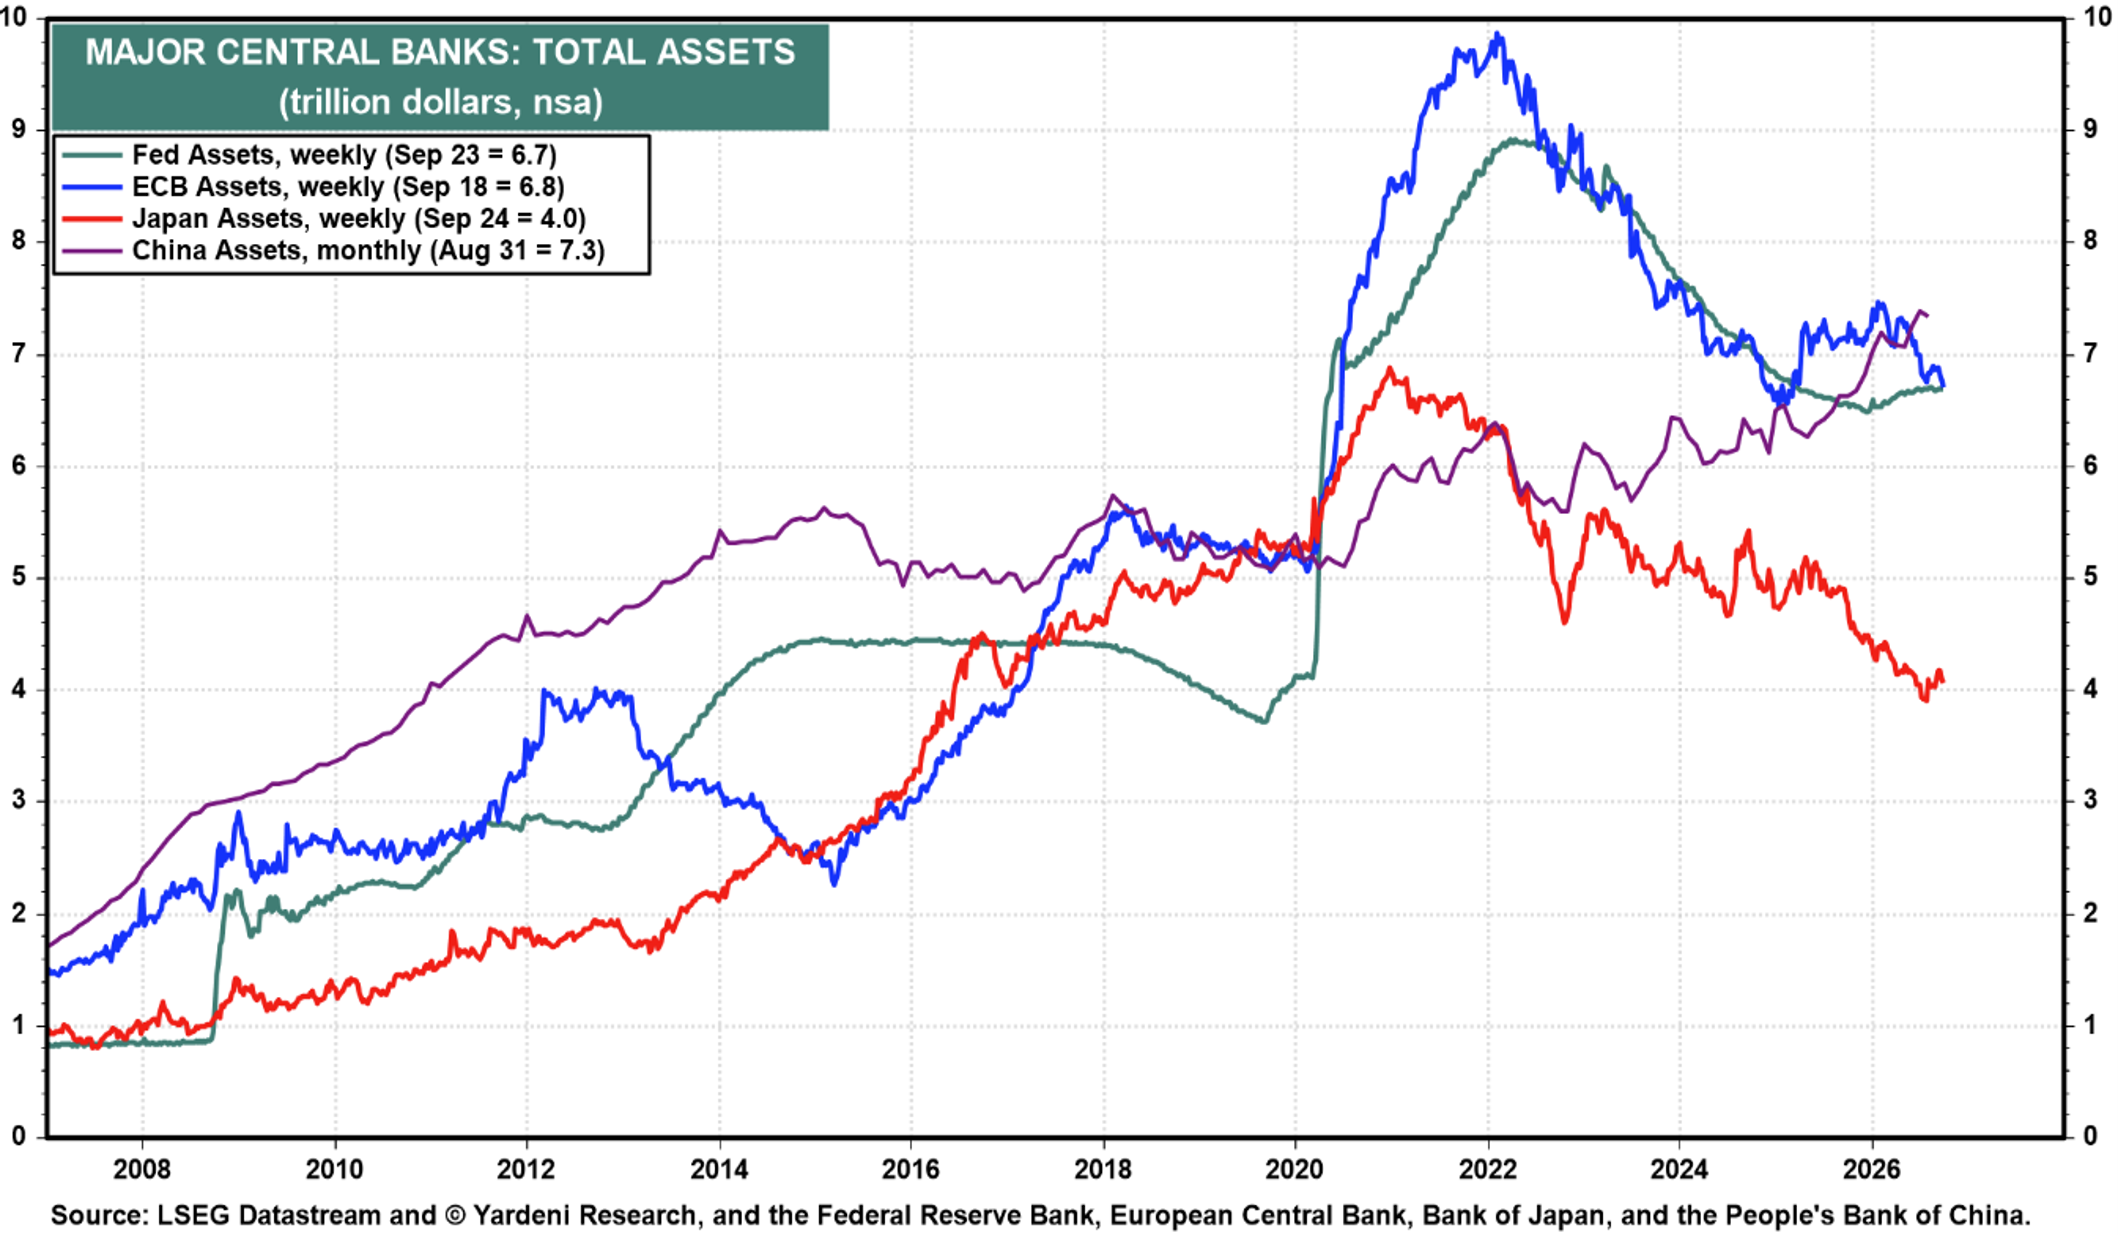
Total assets of the Federal Reserve, European Central Bank, Bank of Japan, and People's Bank of China, in trillions of dollars. Source: LSEG Datastream and Yardeni Research, as of late September 2026 (People's Bank of China as of August 31, 2026).
Long-time readers know that we track these forces through a single summary gauge: global M2, the combined total of cash, deposits, and readily accessible money across the world's major economies, measured in dollars. It is not a separate signal so much as the place where interest rates, central bank balance sheets, bank lending, government spending, and the dollar all register. Historically, the S&P 500 has tracked the expansion and contraction of global M2 with a lag of roughly three months.
In July, we identified global M2 as the dial we would watch most closely through the second half. What it has shown is instructive. Despite rising interest rates and central banks that are no longer adding to their balance sheets, global money supply has continued to expand, reaching a new high of roughly $103.6 trillion. Liquidity, in other words, is not drying up. Its source is changing.
Increasingly, that support is coming from the fiscal side rather than the monetary side. Large government deficits put new money into the economy with every dollar spent. Commercial banks continue to lend, including to corporations borrowing heavily to fund artificial intelligence infrastructure, and every new loan creates a new deposit. The Treasury's long-bond buybacks, and its apparent willingness to tap its nearly $1 trillion cash account, point in the same direction. Those programs are modest relative to a $100 trillion global money stock, and their significance lies more in what they signal than in their size: a Treasury increasingly willing to support market liquidity even as the Federal Reserve withdraws it.
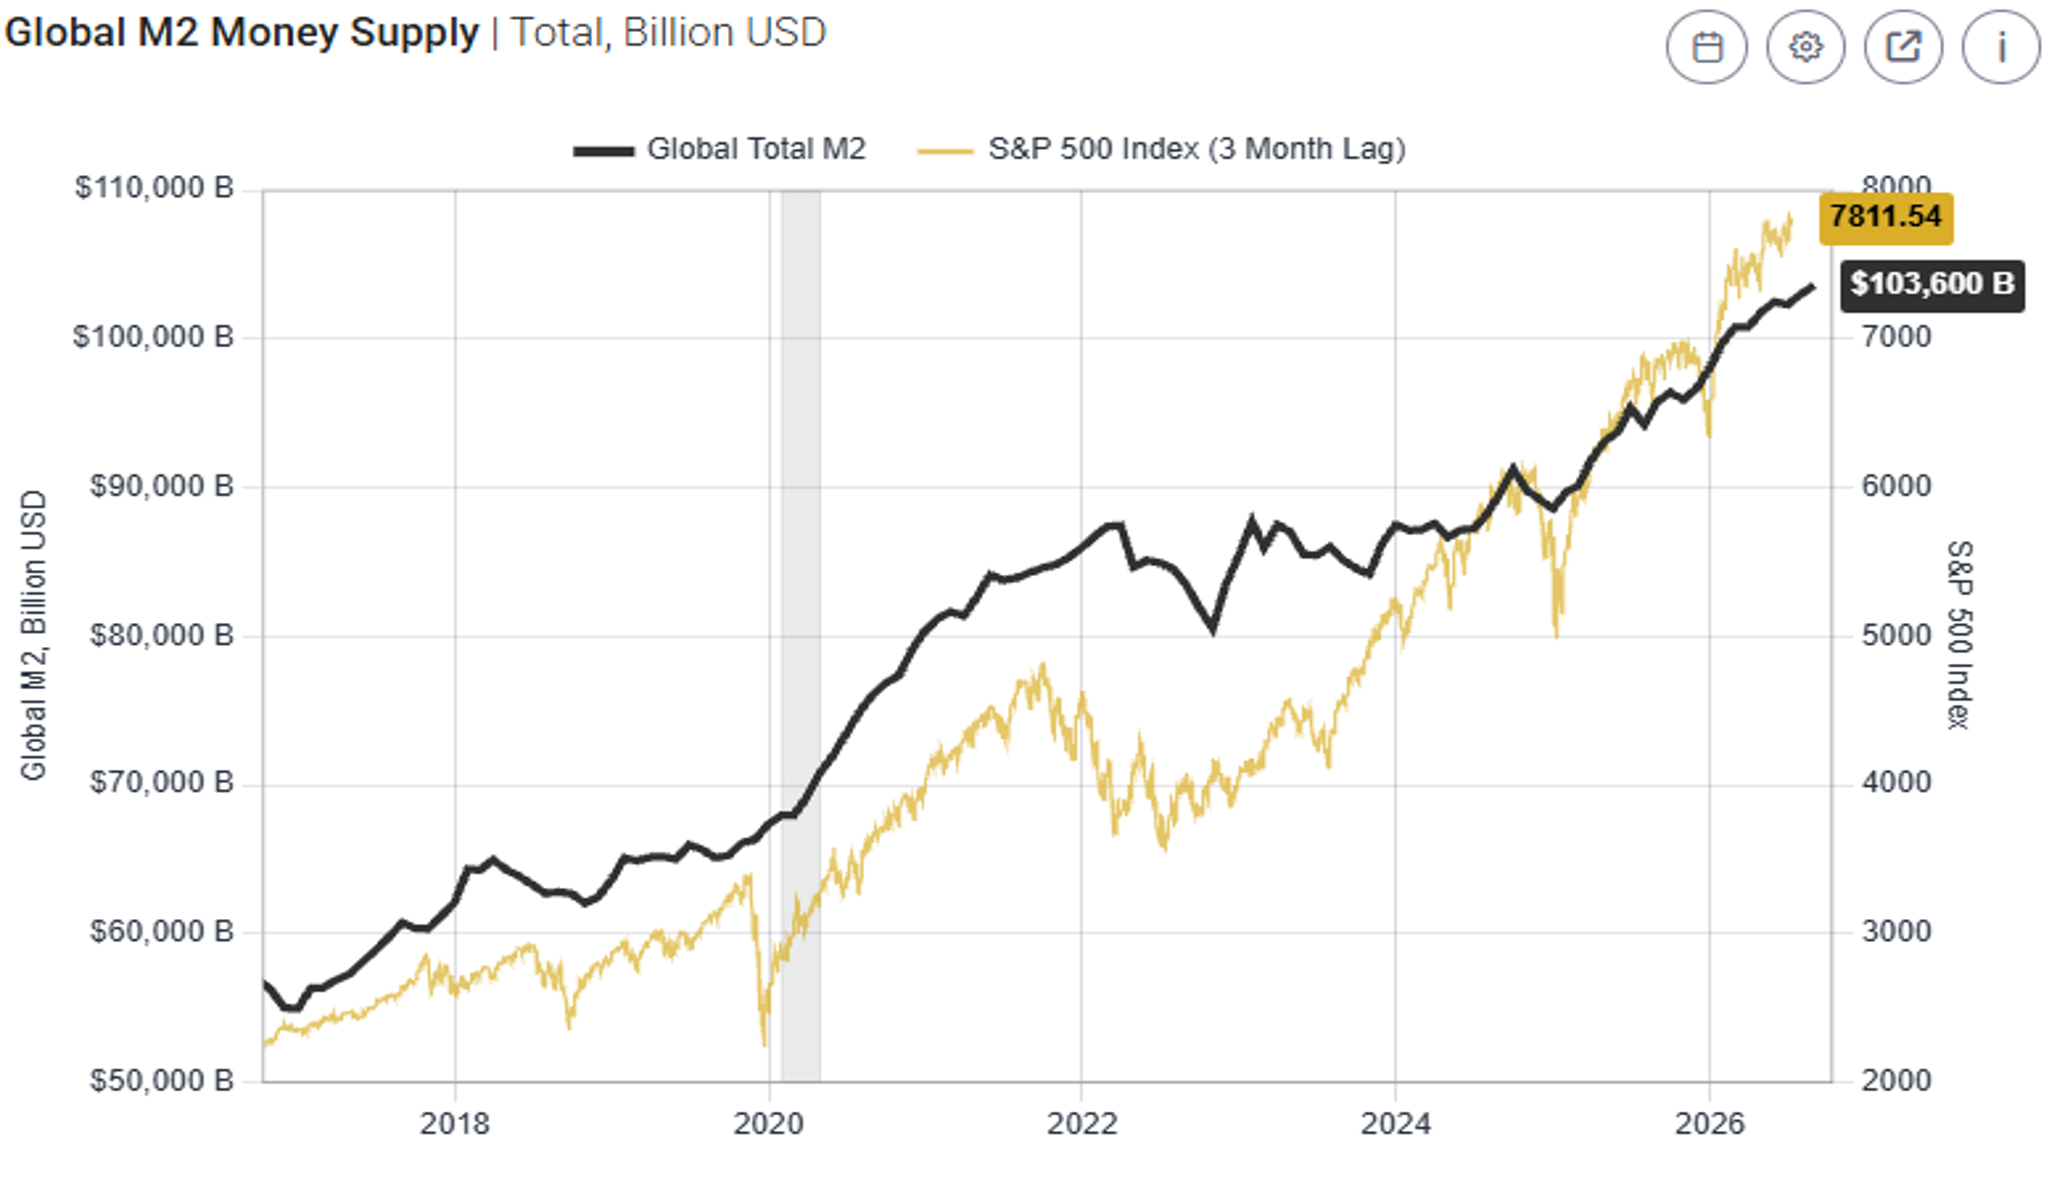
Global M2 money supply vs. the S&P 500, plotted on a 3-month lag. Source: StreetStats, as of August 31, 2026.
This is the defining tension of the current environment: the price of money is rising while the quantity of money is still growing. Central banks are tightening; fiscal authorities are, in effect, easing. That tug-of-war helps explain why the major indices have held up despite the Fed's hike and the bond selloff—and it is precisely why we expect turbulence rather than a steady decline. When markets are pulled between two forces of comparable strength, the balance can shift quickly on a single inflation report, a poorly received Treasury auction, or a policy announcement.
The chart also reveals a second, more cautionary point. Since the start of 2024, global M2 has grown roughly 19%, while the S&P 500 has climbed roughly 60%. Stock prices have run well ahead of the liquidity that has historically supported them. Gaps of that kind tend to close over time, either through faster money growth or through lower prices. And the fiscal support now sustaining money growth has its own limits: it depends on ever-larger deficits in a bond market already demanding higher yields to finance them. Should the Fed resume shrinking its balance sheet while that support fades, the primary offset to tighter monetary policy would disappear. That is the scenario we are watching most closely as we head into 2027.
Geopolitical Landscape
If liquidity sets the tide, geopolitics generates the waves. Two developments warrant attention as we head into year-end: the midterm elections and the global conflicts that continue to drive the price of oil.
The Midterm Elections
On November 3, voters will decide control of Congress for the final two years of President Trump's term. Midterm elections have a long and, on balance, encouraging history for investors. Since 1874, the S&P 500 has gained an average of 1.5% in the month leading into a midterm election, rising 76% of the time. The more powerful pattern has emerged afterward: in the six months following Election Day, the index has gained an average of 10%, finishing higher 87% of the time.
We take that history seriously, but we would caution against treating it as a forecast. The strong post-election rallies of the past have typically emerged from a position of weakness. Midterm years have historically included an average decline of roughly 18% from peak to trough at some point during the year, and the rally that follows has largely represented relief as that pessimism unwinds. This year is different. The S&P 500 enters the election near record highs, and for much of 2026 the market was unusually calm; through August, the index had recorded just four trading days with moves of 2% or more, compared with 46 in 2022 and 20 in 2018. A market that enters a historically favorable window from a position of complacency, rather than fear, has far less pessimism to unwind.
Nor does the election alter the underlying liquidity picture. Whichever party controls Congress, the Fed will still be raising rates, the Treasury will still be refinancing record volumes of debt, and the global central bank tide will still be moving out. A post-election rally is entirely plausible and would be consistent with our expectation of sharp swings in both directions. We would view such a rally as an opportunity to rebalance, not as a signal that the turbulence has passed.
Global Conflicts and the Price of Oil
Beyond the election, the conflict in the Middle East remains the geopolitical risk most directly tied to our outlook. The ceasefire we described in July did not hold, and Brent crude ended the quarter near $100 per barrel, roughly 50% higher than a year ago. Meanwhile, the war in Ukraine enters its fifth winter, with peace talks underway but no resolution yet. The transmission to markets is straightforward: elevated energy prices keep inflation sticky, sticky inflation keeps central banks tightening, and tighter policy drains liquidity. As in the oil shock of 1973–74, oil is not merely a geopolitical story. It is a monetary one.
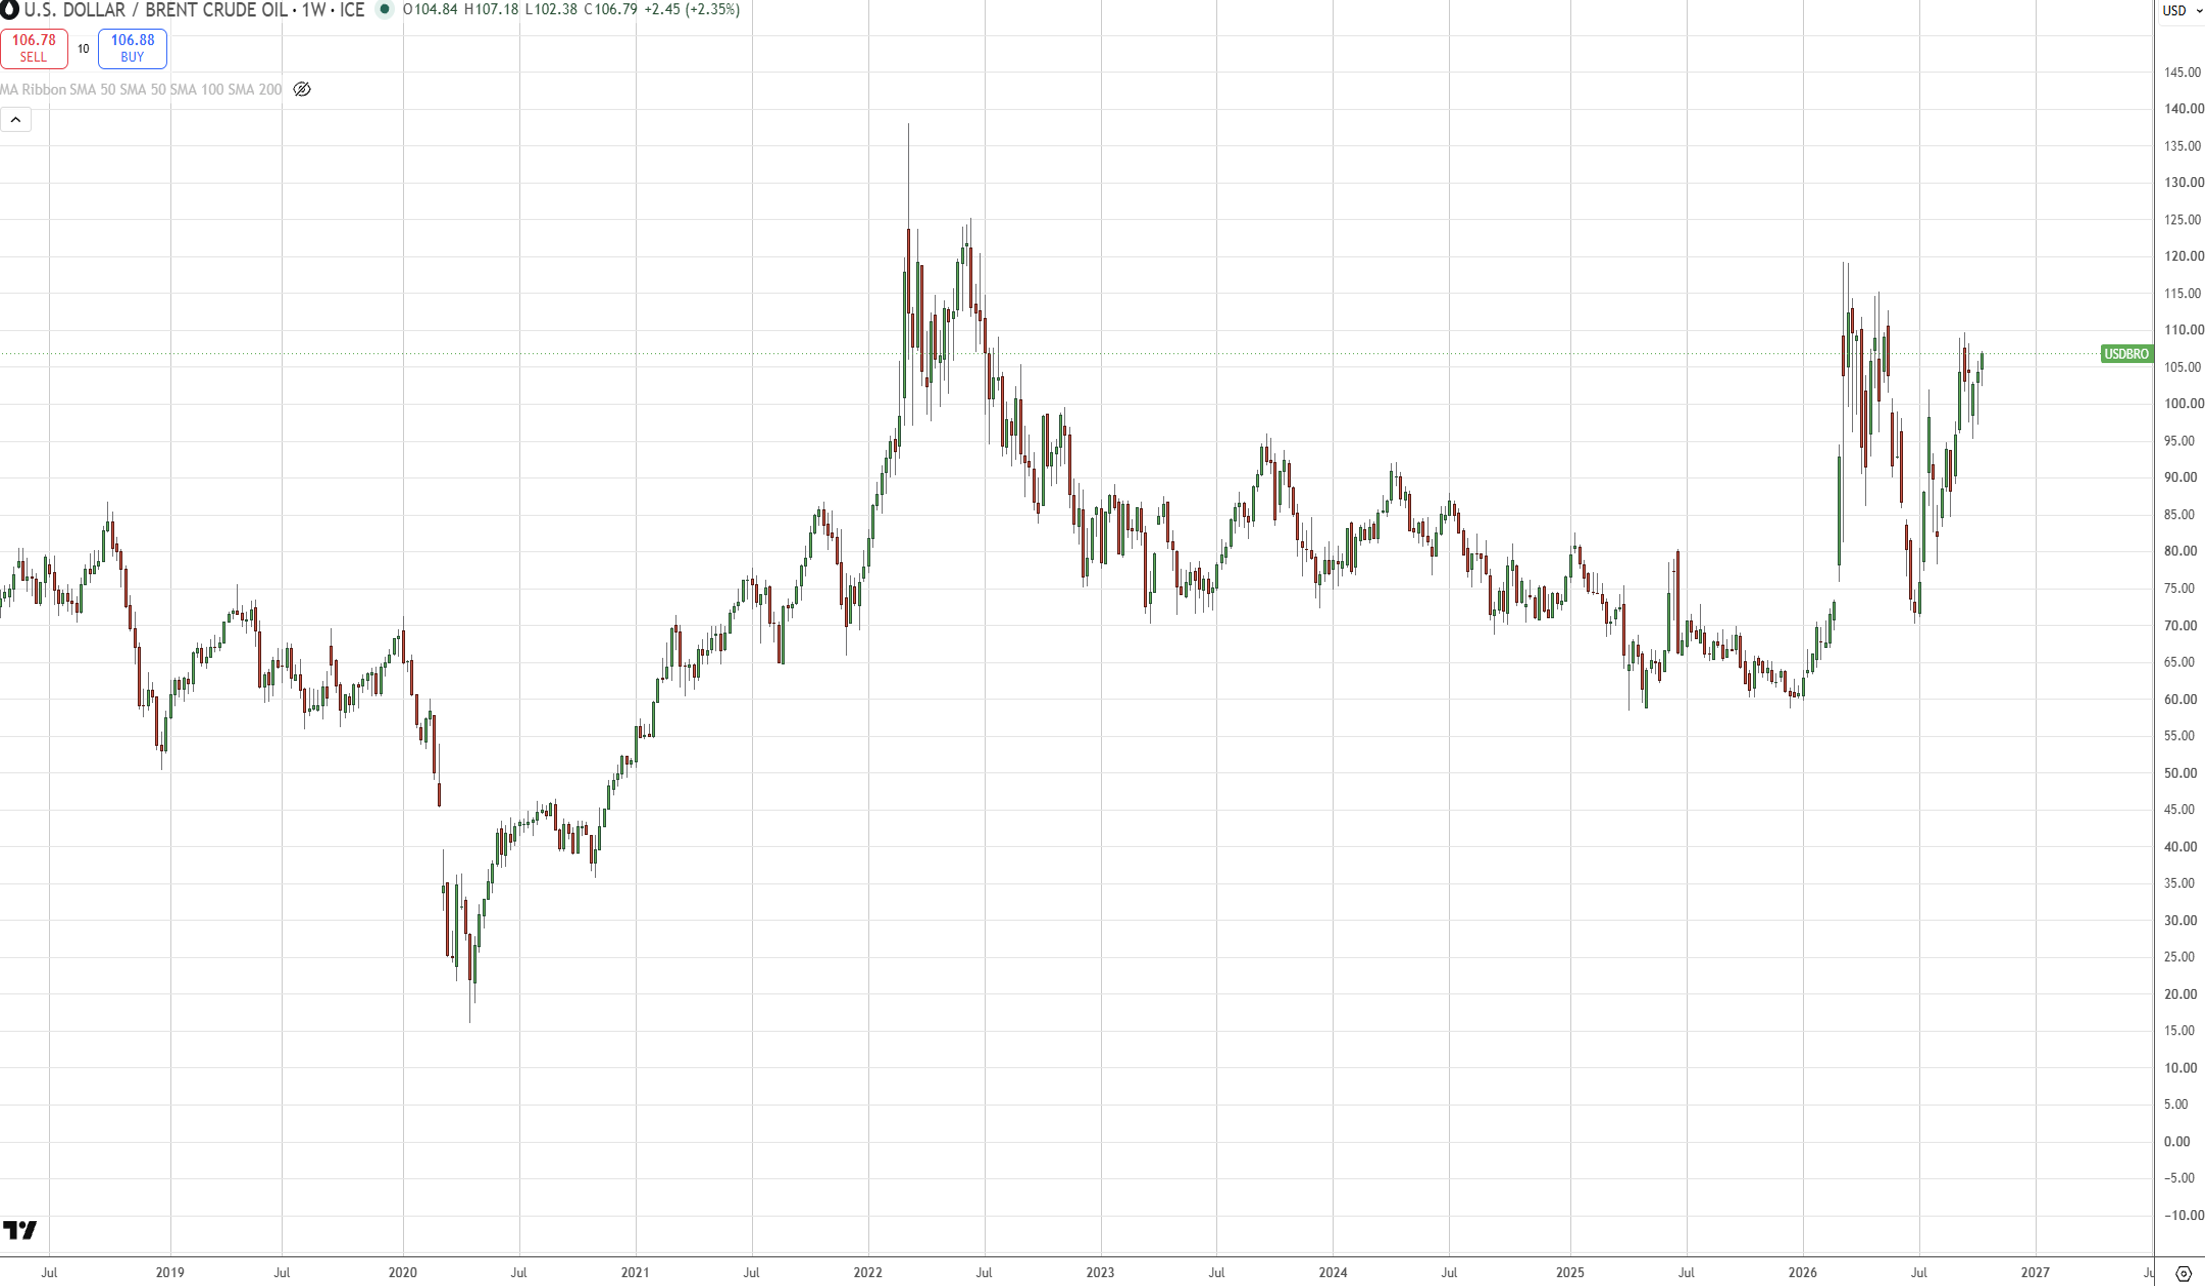
Brent crude oil, weekly, U.S. dollars per barrel. Source: TradingView.com, as of October 12, 2026.
Technical Landscape
Fundamentals tell us where pressure is building; technicals help us gauge how much of it the market has already absorbed. Three signals stand out this quarter: prices stretched well above their long-term averages, momentum that is fading beneath rising prices, and a liquidity cycle that has turned.
Moving Averages and Stretched Price
Moving averages smooth out short-term price swings to reveal the underlying trend. On a weekly chart, the 50-week average reflects the market's intermediate-term direction, while the 100- and 200-week averages capture the longer-term trend. When prices move far above these averages, the market becomes extended, and extended markets tend to revert toward them, either through time or through price.
As we entered 2026, the S&P 500 was trading near its 50-day moving average—a market that was not overstretched and remained technically well-supported. That is no longer the case. Today, the index would need to fall roughly 7% to reach its 50-week moving average, 14% to reach its 100-week, and 26% to reach its 200-week. Should a pullback materialize, the 50-week moving average (near 7,150) would represent the first area of support, followed by the 100-week moving average (near 6,600).
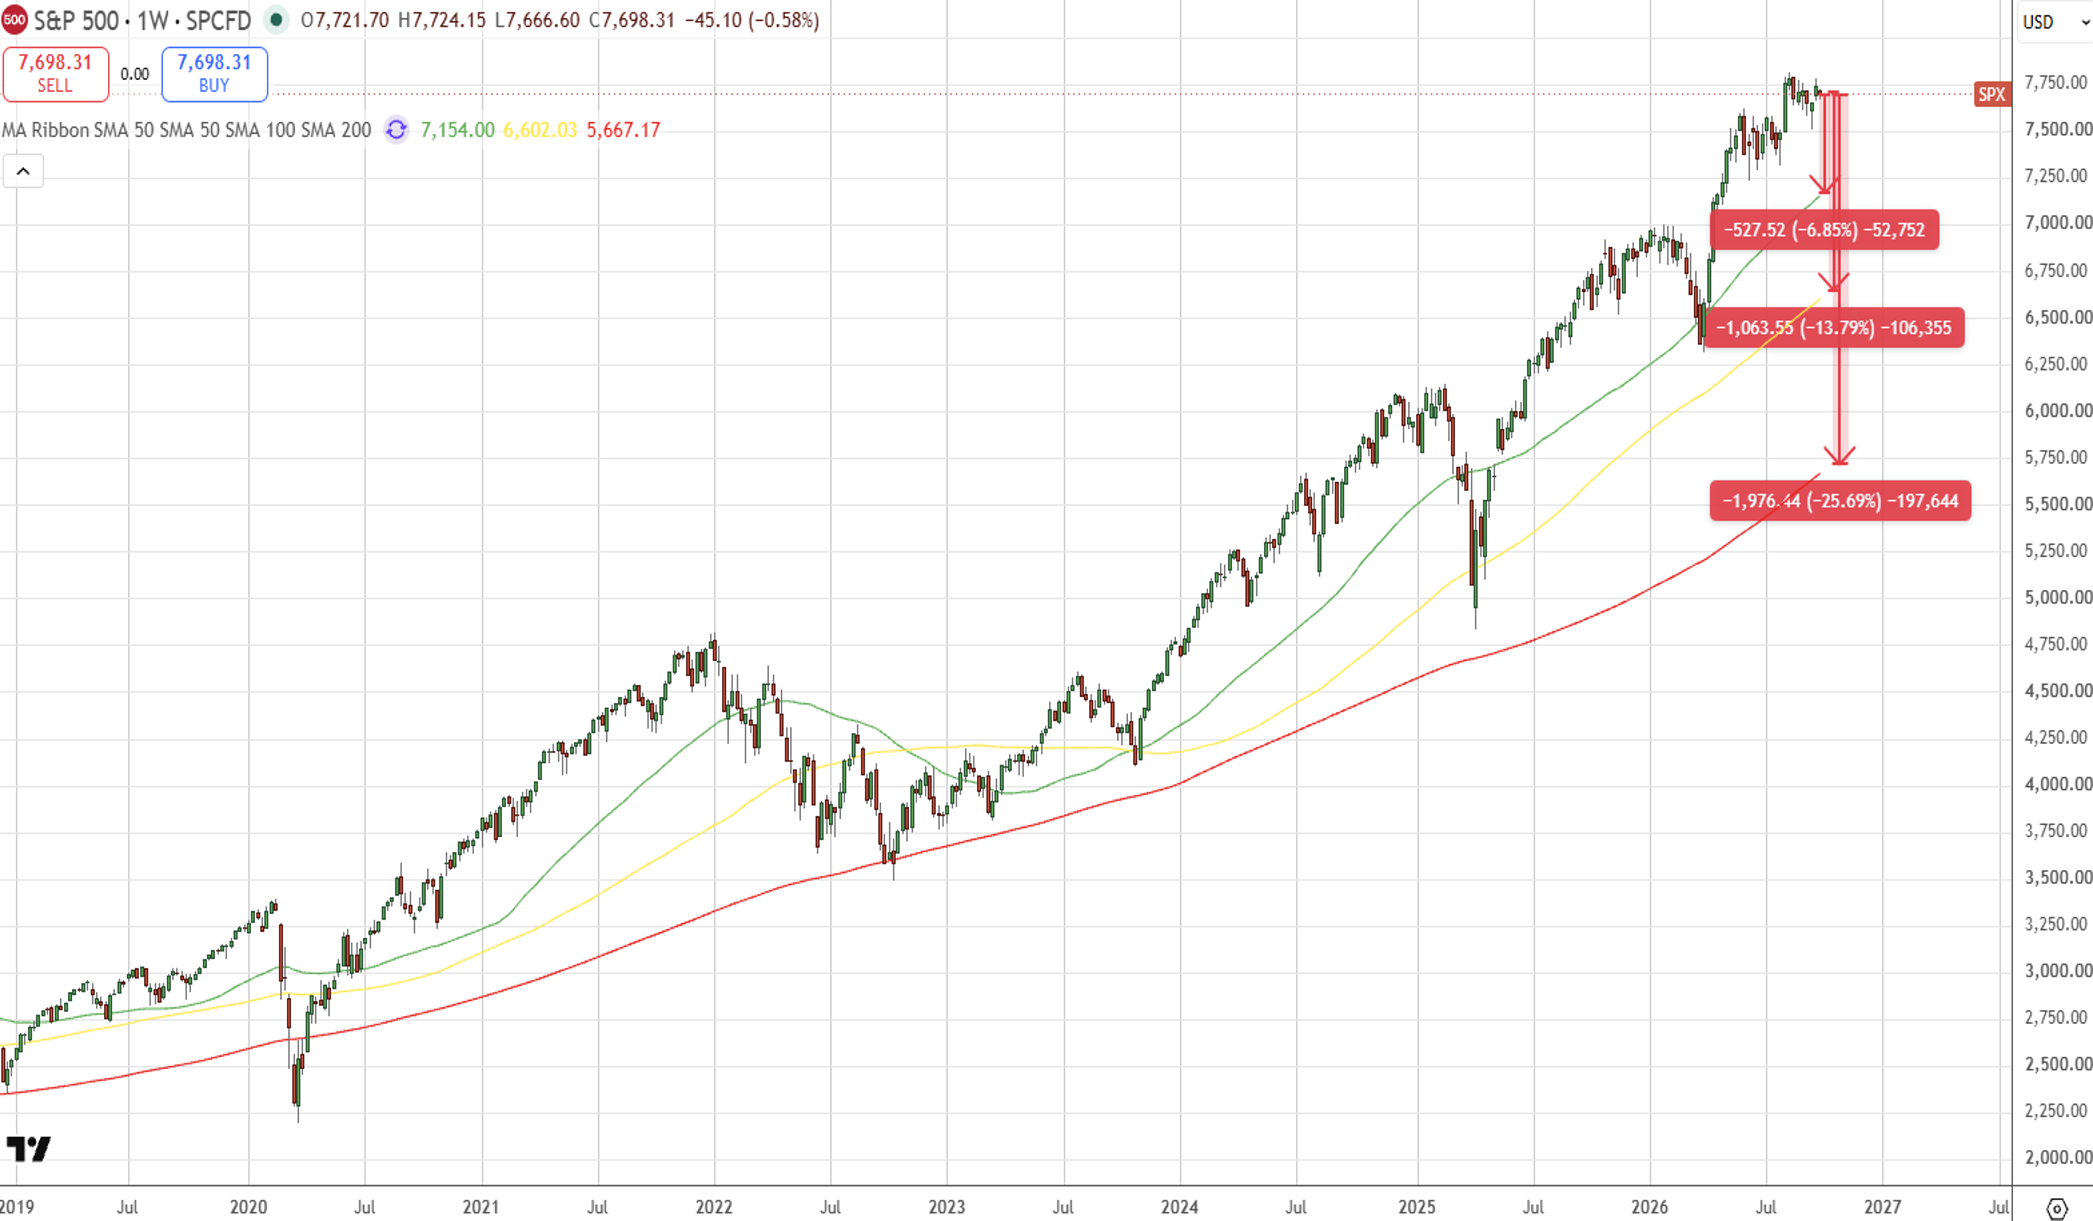
S&P 500, weekly, with 50-, 100-, and 200-week moving averages; arrows mark the decline required to reach each average. Source: TradingView.com, as of October 9, 2026.
Waning Momentum: Bearish Divergence
Beneath the price chart sit two momentum gauges we have discussed in past letters: the Relative Strength Index (RSI, purple line) and the Money Flow Index (MFI, green line), which measure the speed and strength of buying pressure. Readings above 70 on the RSI, or 80 on the MFI, typically signal overbought conditions.
A bearish divergence occurs when prices form higher highs while their corresponding momentum indicators form lower highs. As the chart below illustrates, the S&P 500 has continued to set higher highs since June 2026 (indicated by the upward-sloping green line above the price chart), while the RSI has recorded lower highs (indicated by the downward-sloping red line) and now reads 61. The MFI has faded as well, slipping from nearly 80 in July to 54 today. This implies that momentum is waning even as prices continue to rise—an analogy akin to a rocket that is out of fuel but continues to ascend. Historically, such scenarios have tended to reverse course before finding support.
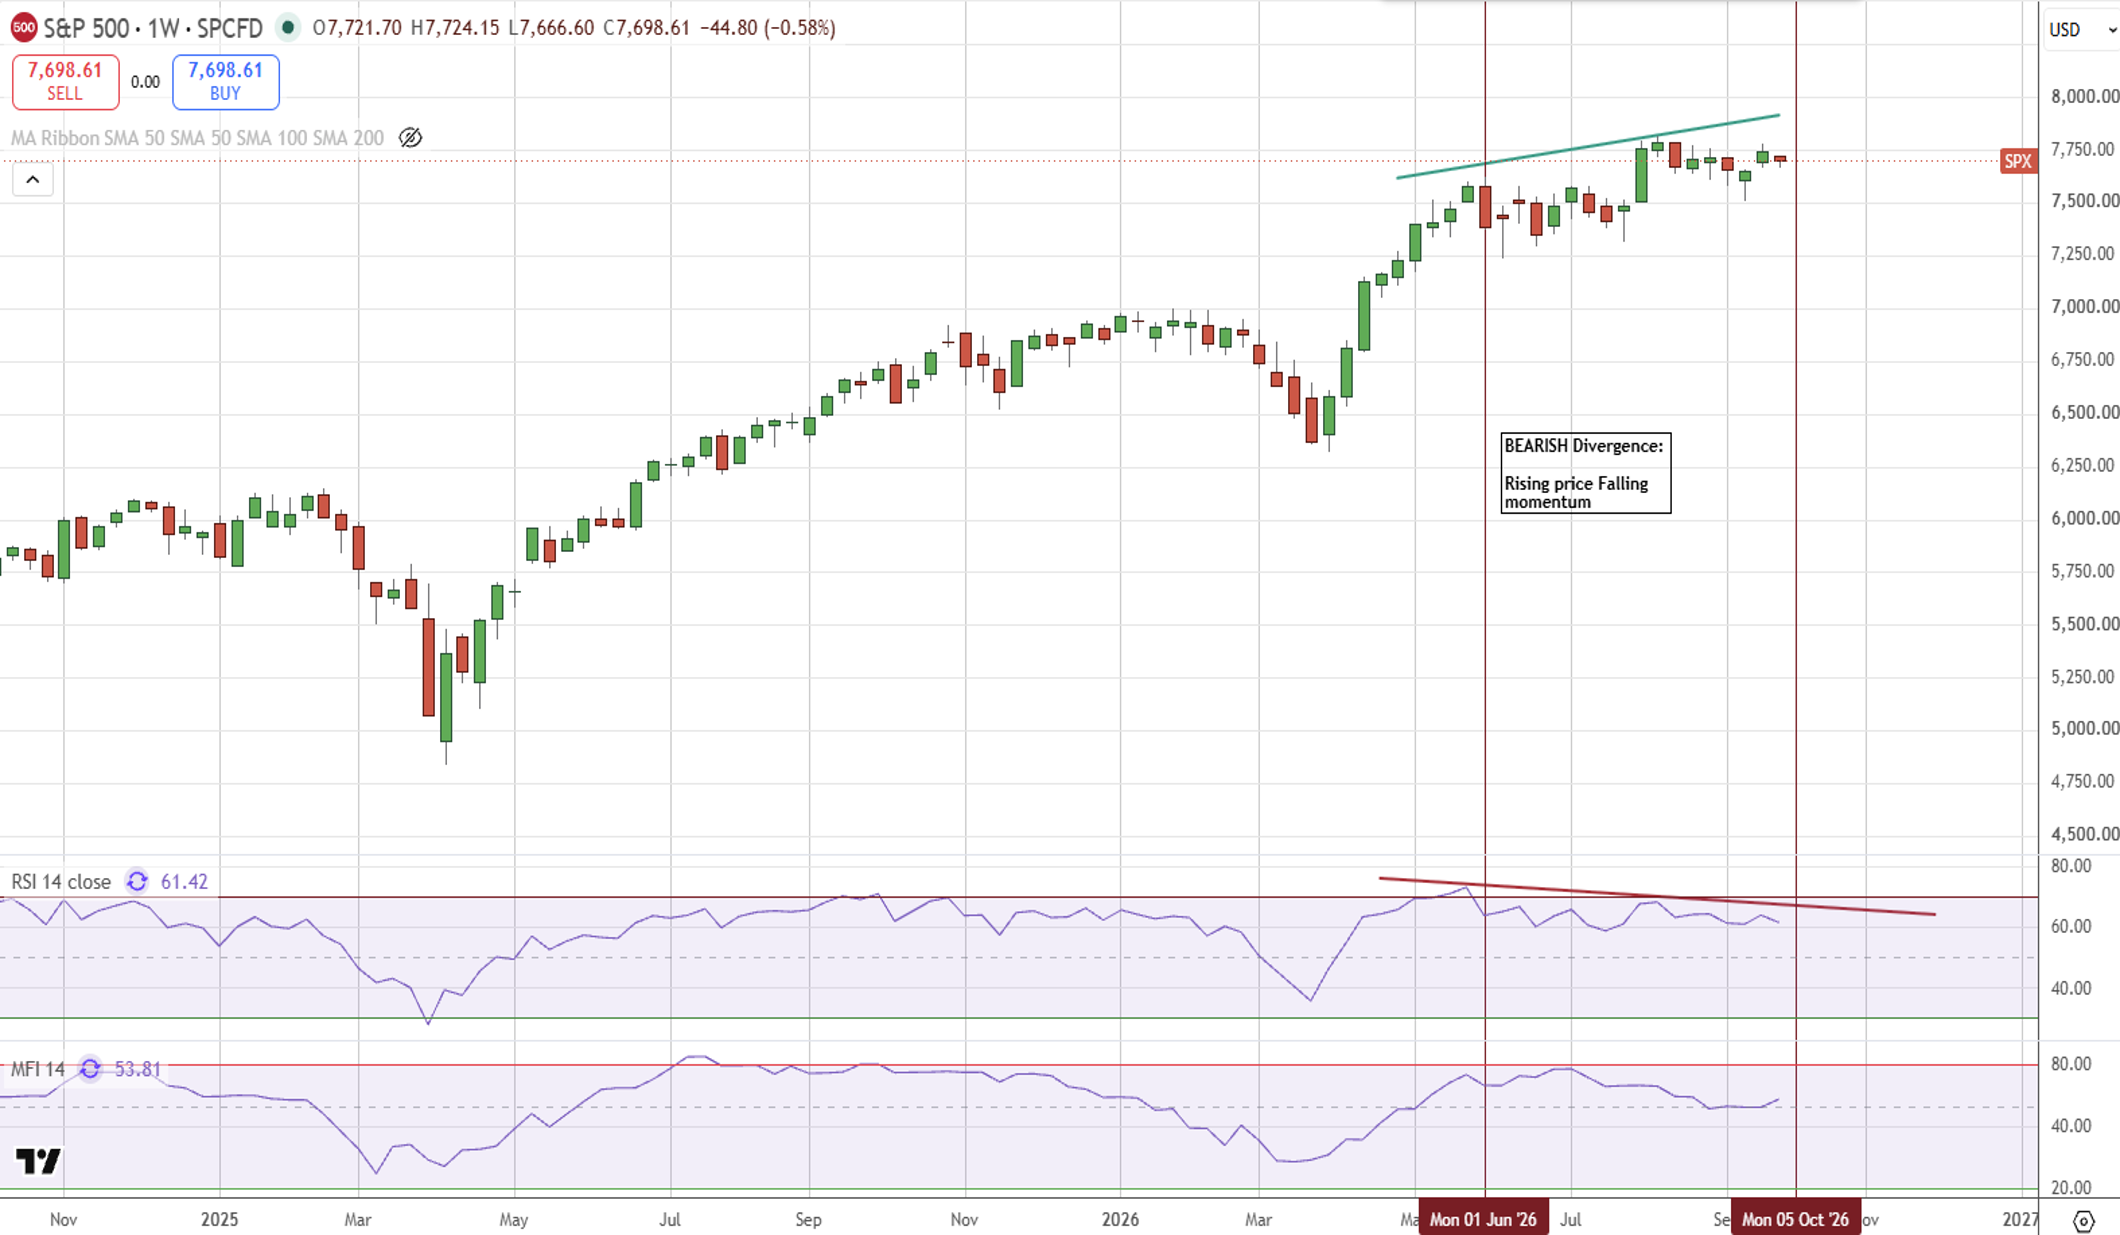
S&P 500, weekly, with Relative Strength Index (RSI) and Money Flow Index (MFI); trendlines mark the divergence between price and momentum. Source: TradingView.com, as of October 9, 2026.
The Liquidity Seasons
Liquidity, like nature, moves in seasons. We frame the liquidity cycle across four phases: Spring brings stimulus and expansion, Summer marks peak activity, Fall signals debt rollover, and Winter reflects contraction or tightening.
In mid-2025, we wrote that we were entering Fall—the period when large tranches of government debt come due and policymakers are compelled to inject liquidity to keep the machinery running. That season played out much as expected. The Fed ended quantitative tightening, lowered rates, and purchased Treasury bills, and markets responded by climbing to record highs.
We now believe the cycle has turned toward Winter, the phase in which central banks withdraw accommodation and liquidity contracts. The policy developments described throughout this letter—synchronized rate increases, balance sheets that have stopped growing, and a money supply sustained increasingly by fiscal rather than monetary support—are consistent with a cycle in which the tide is going out rather than coming in. Historically, these phases have not required an economic recession to unsettle markets; the withdrawal of liquidity alone has been sufficient to compress valuations and widen price swings.
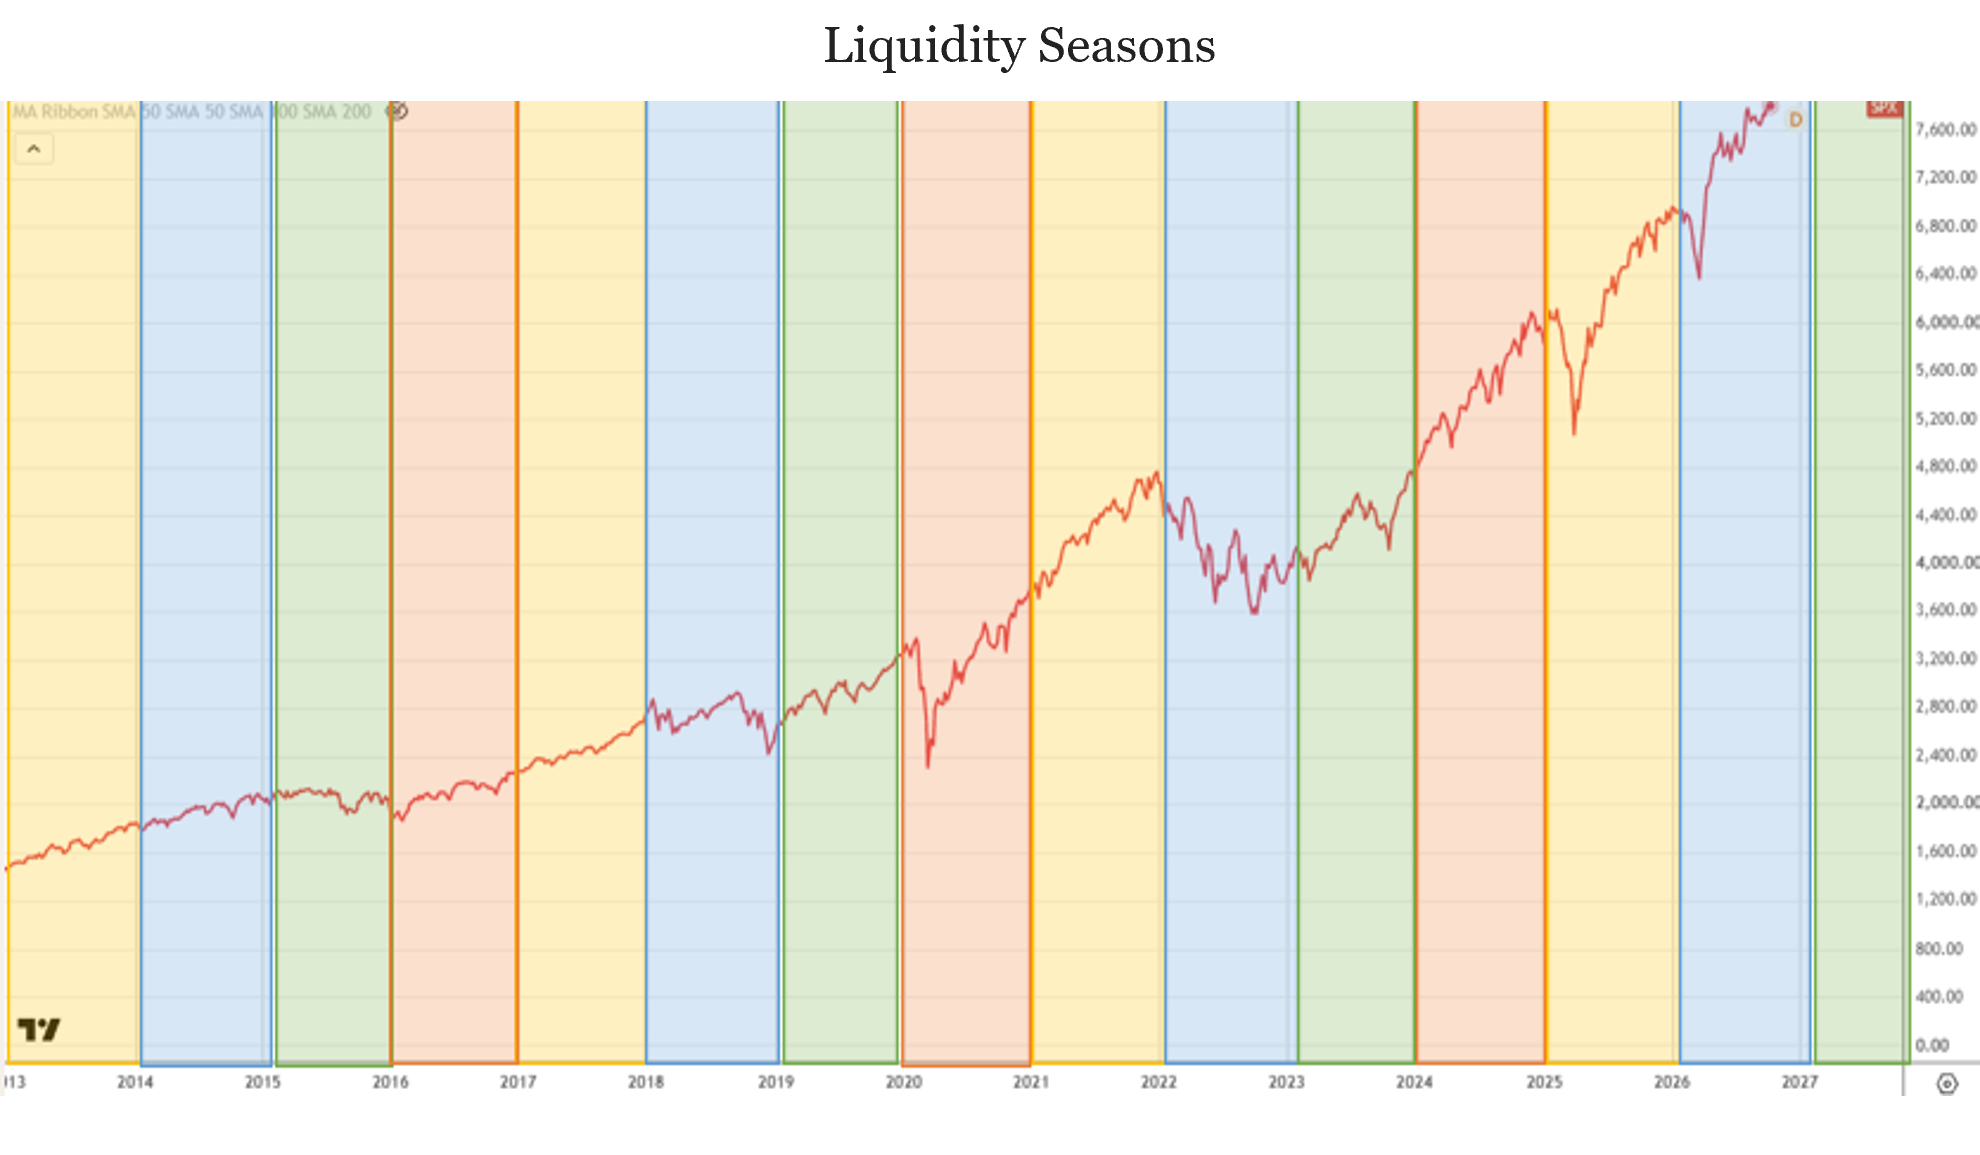
S&P 500 shaded by liquidity season, 2013 to present: Spring (green), Summer (orange), Fall (yellow), and Winter (blue). Source: Raoul Pal at Real Vision and TradingView.com, as of October 12, 2026.
Technical Summary
Taken together, the technical picture points to a market that remains in a long-term uptrend but is increasingly vulnerable. Prices are stretched well above their key moving averages, and momentum indicators are diverging from price. Each of these conditions can persist for a time, and we do not fight established trends prematurely. Combined with a liquidity cycle that has turned against the market, however, they argue that the path of least resistance over the coming quarters is more likely to be sideways and volatile than steadily higher.
Conclusion: Positioning for a More Turbulent 2027
The thread connecting every section of this letter is liquidity. Central banks are withdrawing it through higher rates and leaner balance sheets, while fiscal spending works to replace it—an uneasy balance that rests on a bond market growing less accommodating by the month. Meanwhile, the stock market sits near record highs, supported by a narrowing group of leaders and fading momentum.
None of this amounts to a forecast of collapse. Corporate earnings remain strong, investment in artificial intelligence is real and substantial, and history suggests a post-election rally is well within reason. What we expect instead is the kind of market we described in April: one defined by shorter cycles, wider swings, and sharp rallies alongside sharp declines. In that environment, the passive approach that served investors well during a decade of abundant liquidity is unlikely to be rewarded in the same way. Discipline—in valuation, in risk management, and in rebalancing—matters more.
Our positioning reflects that view. Earlier this year, we harvested gains in positions that had become extended, moved a portion of the proceeds into short-term Treasuries that now offer attractive yields along with flexibility, and shifted our fixed income sleeve toward actively managed strategies capable of navigating a volatile rate environment. We made no changes in the third quarter, as our current allocation already reflects the caution outlined in this letter. Periods of turbulence also create opportunity, and we intend to hold enough dry powder to take advantage of it.
Understanding where we are in the liquidity cycle is critical. Positioning accordingly is what matters most.
Sources:
Federal Reserve, June 2026 FOMC Summary of Economic Projection
U.S. Bureau of Economic Analysis, Personal Income and Outlays
U.S. Department of the Treasury, Buyback Program Announcement,
FRED: Federal Reserve Economic Data
Yardeni Research and LSEG Datastream
All information herein has been prepared solely for information purposes, and it is not an offer to buy or sell, or a solicitation of an offer to buy or sell any security or instrument or to participate in any particular trading strategy. The views expressed represent the opinion of the Firm and should not be considered tax advice. For tax advice, please consult a CPA. The views are subject to change and are not intended as a forecast or guarantee of future results. This material is for informational purposes only. It is not intended to be investment advice or a projection of future investment performance. No one can foresee the future and, it is not a projection of the potential return of any investment, nor is it a projection of future inflation rates or the state of the world or domestic economy. Returns should not be considered a guarantee. Pie charts are target weights for Models and may deviate for market movements or specific client accounts.